The WSJ recently ran article about another financial professional who has seen the light and now advocates index investing.
Is Your Stockpicker Lucky or Good?
Investors pick active funds based on performance, but the long-term success of those managers is no more dependable than a coin flip
Is it luck or skill? Picking a fund manager who can beat the index is tough, but picking one who beats it through actual ability is far more difficult.
Victor Haghani, a co-founder of one of the best-known investment firms in history, says the most surprising thing is that people have great confidence that they can pick these super-talented fund managers. Currently the chief executive of Elm Partners, which espouses index investing for wealthy clients, Mr. Haghani will try to prove that to you with a simple test.
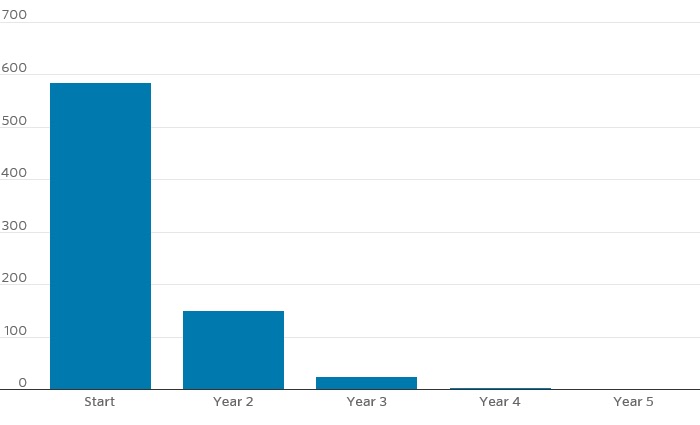
He and two colleagues told several hundred acquaintances who worked in finance that they would flip two coins, one that was normal and the other that was weighted so it came up heads 60% of the time. They asked the people how many flips it would take them to figure out, with a 95% confidence level, which one was the 60% coin. Told to give a “quick guess,” nearly a third said fewer than 10 flips, while the median response was 40. The correct answer is 143.
Mr. Haghani’s belief in indexing means he has a vested interest in the outcome. His earlier experience as an active investor gives him perspective on how hard it is to beat the market. Mr. Haghani was a co-founder of Long Term Capital Management, the hedge fund that had spectacular results from exploiting real market anomalies before its failure nearly took down the global financial system in 1998.
The research applies directly to picking fund managers. We already know that most active managers fail to beat an index fund in any given year, yet many people pay up for managers they believe have the skill to do so.
The research applies directly to picking fund managers. We already know that most active managers fail to beat an index fund in any given year, yet many people pay up for managers they believe have the skill to do so.
In fact most active managers perform worse than a coin flip. We are often told that the bulk of the returns from the market come from a few stocks. That fact is then is seen as implying this is an opportunity for stock pickers. They just have to overweight those stocks and they will outperform. Most actively manged funds are "closet indexers" meaning that the "active share" the part of the portfolio that differs from the rindex is small in many cases as low as 20%. That means the stock picker "just" needs to pick outperformers for the active share of their portfolios to beat the index
Of course they fail to do so and there is no persistence among those that do.
An interesting explanation of the underperformance of active managers and how they actualy do worse than a coinflip comes from the material presented in this article entitled Skewered
Consider the chart below. The returns of stocks are skewed

What is the significance of this chart ? It is pointed out that in the recent market (election day since to the end date of the research data April 2016) in that right hand tail there were 6 stocks that returned over 50%.. But stock returns are almost always skewed the majority of stocks fall on the right side of the tail even if not as much as in the current market of FANG stocks (facebook, apple, Netflix, google) which so dominate the market gains.
The distribution of returns as seen above is skewed to the right a "fatter tail than the standard deviation. With that fatter tail composed above average perfoming stocks.
That means that the task of the active manager should be "simple". As we always hear "it's a stock pickers market", All that an active manager would need to do is to oild most of his portfolio in an index hugging portfolio and add to that portfolio an active share of stocks he has picked made of of stocks among those in the right tail.
That means that the task of the active manager should be "simple". As we always hear "it's a stock pickers market", All that an active manager would need to do is to oild most of his portfolio in an index hugging portfolio and add to that portfolio an active share of stocks he has picked made of of stocks among those in the right tail.
In fact looking at the chart there are more stocks to the right of median return than below it. So the odds are actually better than 50/50.to get a stock performing above the median in a coin flip. It is like picking to get a high card from a deck where money of the cards wth low values have been removed from the deck.
Yet we know the statistics. Active managers consistently fail to beat the index they do worse than a coin flip.
____________________________________________________________________
____________________________________________________________________
Is this an argument for the momentum factor
Here is the description of the methodology for MTUM from ishares:
The iShares Edge MSCI USA Momentum Factor ETF tracks an index of large- and midcap US equities, selected and weighted based on price appreciation over 6- and 12-month periods and low volatility over the past 3 years.
Not surprisingly the portfolio is quite concentrated by sector with 32% of its assets in technology and 25.6% in financials .The portfolio is also highly concentrated by stocks 42% of the portfolio is in its top ten holdings. In other words, at least in terms of recent performance the ETF is owning mostly stocks in the right tail. Barring shap reversals in the stocks within the period between of rebalances the portfolio should have structural potential to ourperform. And the portfolio rebalances more frequently during periods of high volatility as explained the Morningstar analysis:
In order to improve performance when volatility spikes, the fund's benchmark rebalances in between the scheduled reconstitution dates if market volatility significantly increases. When this rebalancing is triggered, the index focuses on more-recent momentum to construct the portfolio. This adjustment may help, but it isn't a panacea. There is also a risk that momentum may become less profitable as more investors attempt to take advantage of it. That said, the momentum effect hasn't gone away even though it was first published in the academic literature in 1993. Like any strategy, momentum can underperform for years. This risk may limit arbitrage and allow momentum to persist.
In order to improve performance when volatility spikes, the fund's benchmark rebalances in between the scheduled reconstitution dates if market volatility significantly increases. When this rebalancing is triggered, the index focuses on more-recent momentum to construct the portfolio. This adjustment may help, but it isn't a panacea. There is also a risk that momentum may become less profitable as more investors attempt to take advantage of it. That said, the momentum effect hasn't gone away even though it was first published in the academic literature in 1993. Like any strategy, momentum can underperform for years. This risk may limit arbitrage and allow momentum to persist.
Also note that the portfolio only holds large and midcap stocks This limits the likelihood of owning "shooting star" stocks which are small cap high valuation and large upside momentum--and subject to sharp downward momentum. It is also important to note that MTUM is simply a large cap growth strategy..the methodologies for stock selection are far different.
My interpretation of the potential of outperformance of momentum stocks vs the market :
- :Because of the high concentration in a few stocks the MTUM is likely to be more volatile than the overall market.
- But by concentrating its holding in stocks in the right tail...at least by recent momentum ...its likelihood of outperfromance is greater than 50/50 and greater than an active manager.
- A reversal of upside momentum does not necessarily mean underperformance by MTUM the market could reverse direction but the highest upward momentum stocks could retain their value more than the overall market
- Despite what is regarded as conventional wisdom it does not necessarily follow that the high momentum stocks will lead the market down. Furthermore as the MTUM s rebalanced the opposite will be the case the negative momentum stocks will be eliminated from the portfolio.
We don't have much data on MTUM since it only began trading in late 2013 but here is the data we do have vs the S=P 500.
Total Returns
 |
| Mtum Blue SPY (S+P 500 Green) June 2013- present |
Returns top volatility below.

Remember that volatility is a measure of both up and downside volatility. Investors care much less or not at all about upside volatility. And if you look at the total return chart you can see almost all the high volatility for MTUM was on the upside.
No comments:
Post a Comment